Platform Box Quick Start
To verify the fault tolerance and recoverability of the system, you can inject appropriate faults into the system and observe the system performance to identify possible problems and rectify them in time. This paper uses the CPU full load experiment as an example to describe how to use the Box platform for fault injection.
Step 1: Install the probe
Probes are primarily a command channel and data collection, so they need to be installed on the machine or cluster they are running on Go to the Box main screen, select Overview in the left navigation bar, and click Install a experiment Probe in the Welcome Failure experiment section. For details, see Probe Installation Guide
Step 2: Creating an experiment
- In the left navigation bar of the AHAS console.Select My Space
- On the top left corner of the My Space page click New experiment, then click New Blank experiment.
- On the experiment Configuration page, fill in the experiment Name, experiment description, and experiment label.
- Do the following configuration in the Experiment Object section of the Configuration TAB

- On the experiment object page,set the group name、resource type, and machine list.
Note the machine list You can select one or more machines.
- Click + Adding an experiment,then select The CPU on the host is fully loaded,then click confirm.
- Click save,then click next.
- On the experiment object page,set the group name、resource type, and machine list.
- At Global Configuration complete the following configuration.
- Select Experiment Process for Execution in sequence.
- At Recovery Policy Area + Adding a Policy, select CPU Specifications,then click confirm.
- Set the automatic recovery time to 30 minutes.
- click Next.
Step 3:Executing an experiment
- Choose from the navigation bar on the left chaos experiment > my space。
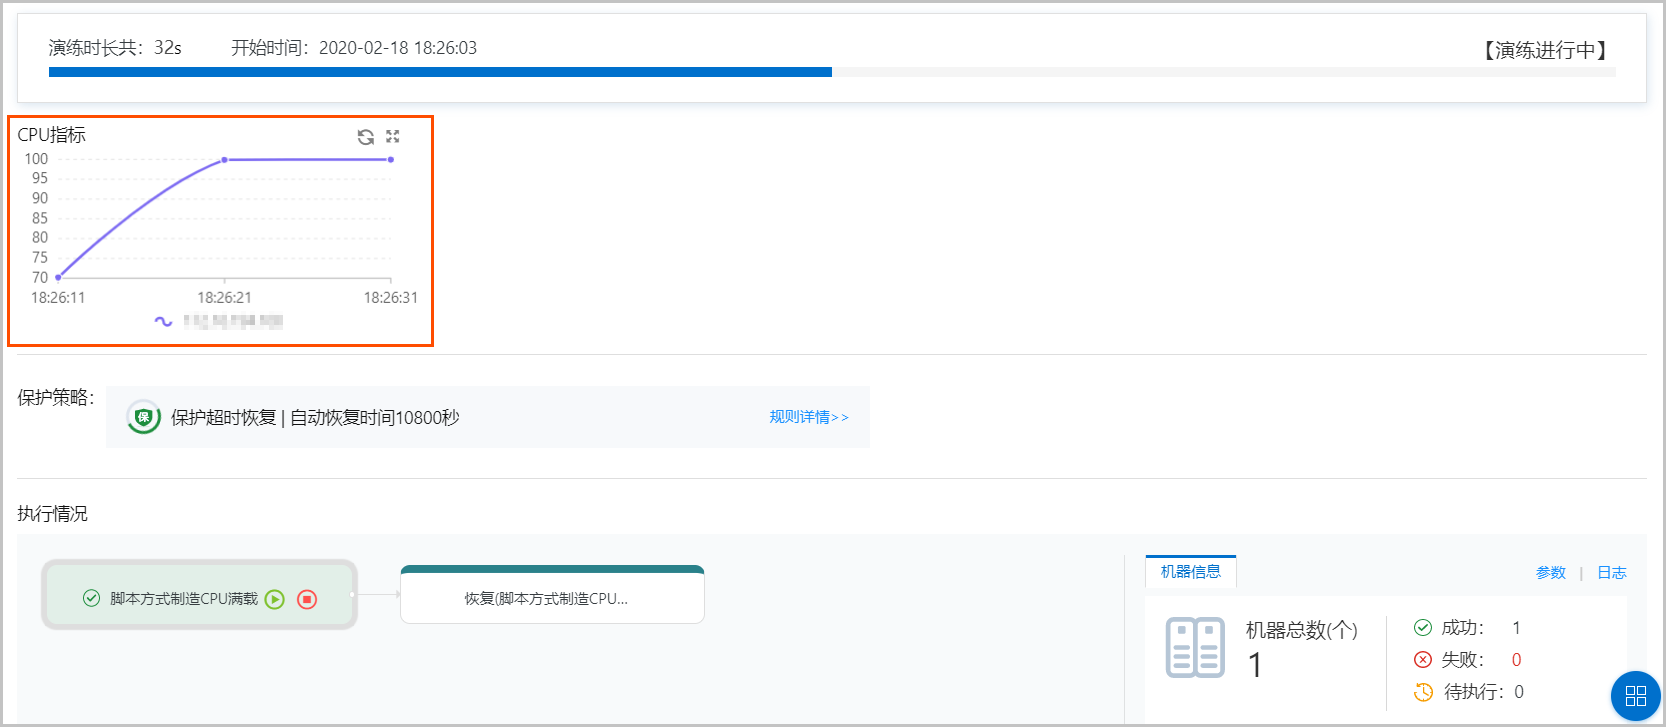
- At my space Click on the right of the target experiment task experiment of the operation column,then at Start performing the experiment Click in the dialog box confirm.After the fault is injected, the CPU indicator of the target machine increases, indicating that the fault has taken effect.
Step 4:Stopping an experiment
You can stop the experiment in the following two ways.
- Automatic stop: If the experiment time exceeds the automatic recovery time, the experiment stops automatically.Available on the experiment page Protection Policy Area View the automatic recovery time,In this example, 30 minutes.

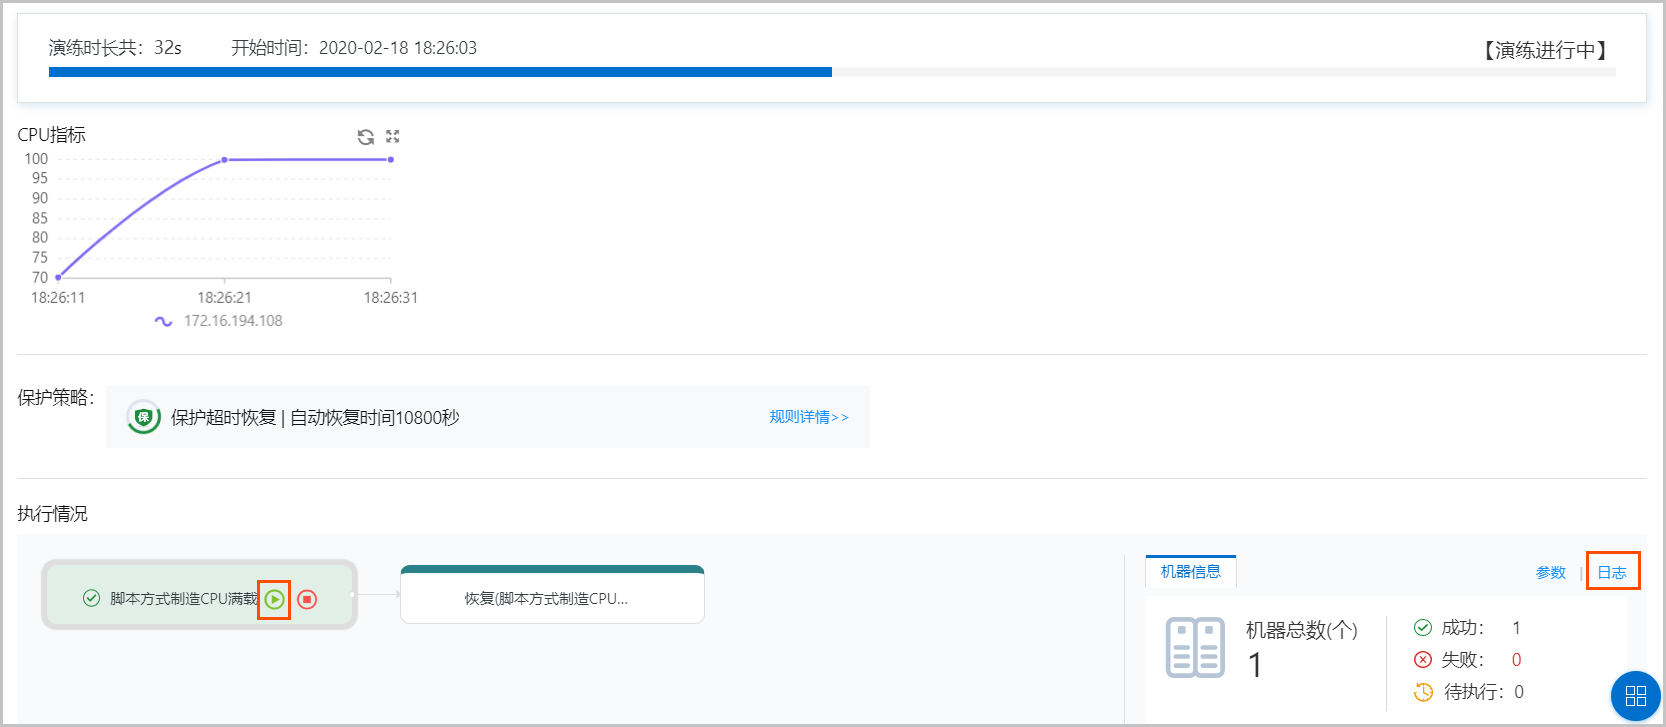
- Manual stop:In practice Status of Execution Area Click Log. If the current step is complete, wait for user confirmation is displayed in the log,then click Create a CPU load in script mode The Continue icon on the right resumes the experiment. To stop the experiment directly, click the Stop icon。
Viewing experiment Information
After the experiment is complete, you can view the experiment duration, CPU indicator curve, experiment parameters, and experiment logs on the experiment details page.
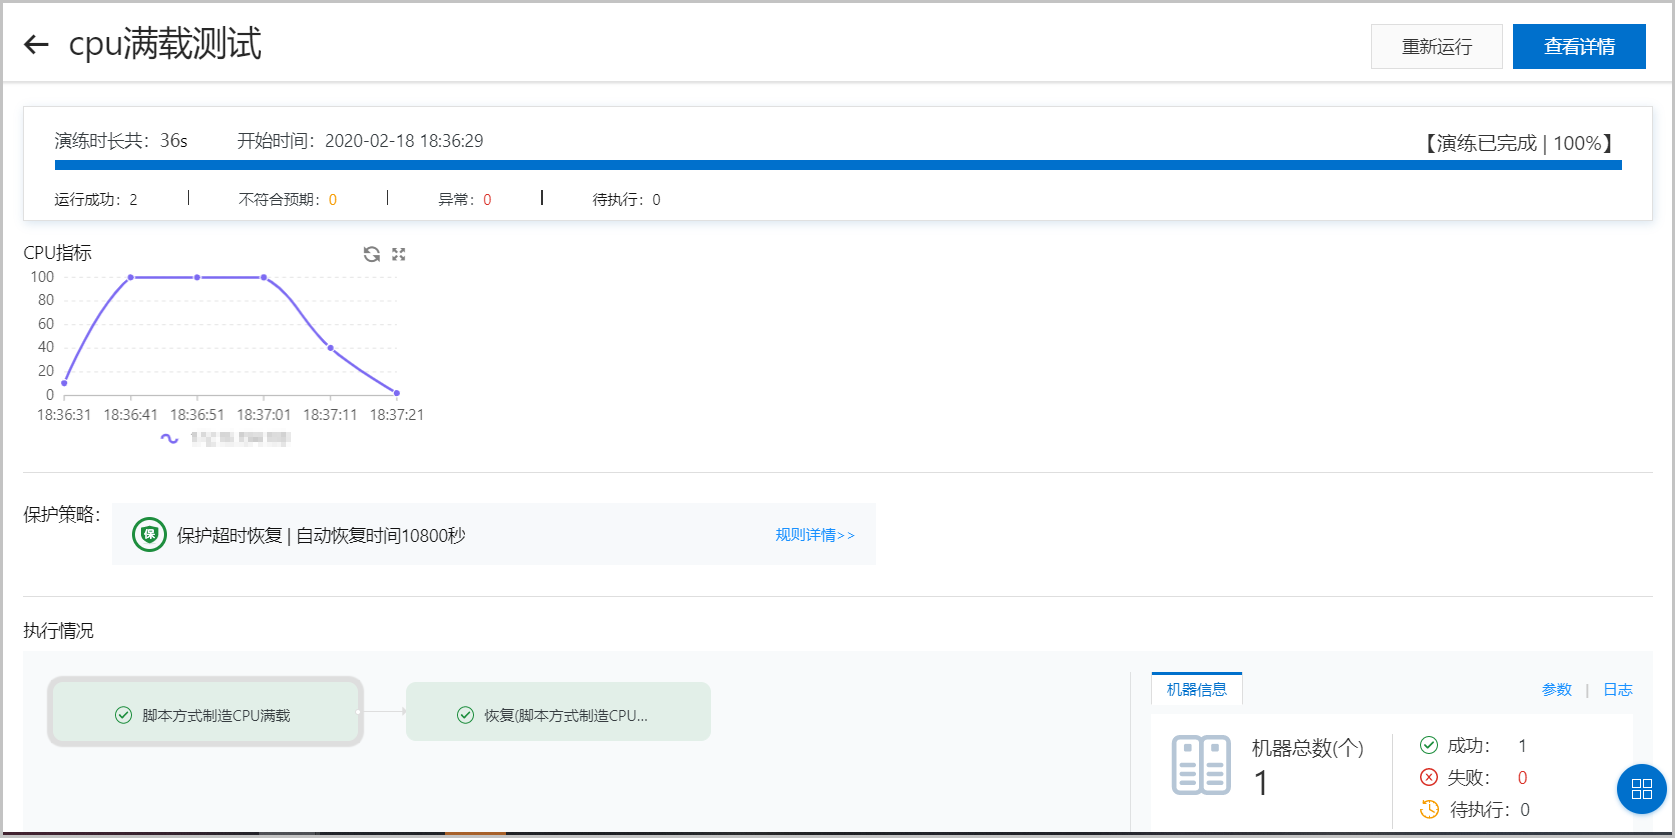
- Slide the mouse to CPU Specifications Time sequence curve,You can view specific CPU indicators of the experiment machine at a certain point in time.
- Information of machine Of the region parameter,You can view the execution parameters of a fully-loaded CPU node.
- Click Information of machine Of the region log,You can view logs about the experiment process.
- Click Top right corner of the page View Details,You can view the configuration and experiment logs of the experiment task.